[1]:
import numpy
import matplotlib.pyplot as plt
%matplotlib inline
[5]:
from ipywidgets import interact, Checkbox
[6]:
f = numpy.sin
Let’s generate a signal and sample it
[7]:
maxt = 100
t = numpy.linspace(0, maxt, 1000)
y = f(t)
[8]:
def show_sampled(T=6.7, show_f=True):
    t_sampled = numpy.arange(0, maxt, T)
    y_sampled = f(t_sampled)

    if show_f:
        plt.plot(t, y)
    plt.scatter(t_sampled, y_sampled)
    plt.axis([0, maxt, -1.1, 1.1])
[9]:
interact(show_sampled, T=(0.1, 10), show_f=Checkbox());
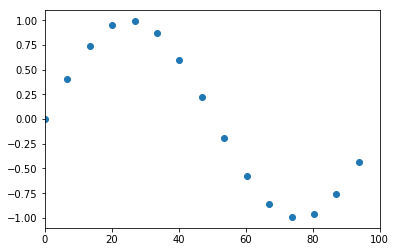
The default sampling rate in the demo above illustrates the idea of aliasing, where a higher frequency sinusoid can masquerade as a lower frequency one. We can avoid this problem by ensuring that we sample at least twice per cycle for the highest frequency in the signal we are sampling. See the Wikipedia page on the Nyquist-Shannon sampling theorem for more information.